GraphPad Prism is already the preferred analysis and graphing solution for scientists, thanks to its powerful statistical tools, elegant and easy-to-customize graphs, and time-saving features for organizing analyses and results.
Now, with the release of Prism 10 (you can read the announcement here) Prism is offering new and better ways to enhance the efficiency of scientific progress. With a new, more open file format; novel tools for graphing, analysis, and collaboration; and improvements to the way data is handled, users can experience faster performance and support for larger datasets than previous versions.
Read on to learn about how Prism 10 is built to support scientists through customization, collaboration, and integration with other key scientific software.
A More Open & Accessible File Format
The new, more open Prism file format enables organizations to connect scientific workflows that allow for greater collaboration and interdisciplinary research. This means any data that goes into Prism can be programmatically extracted so that different aspects can be explored for further insights. This fosters scientific progress by enabling workflows between bench scientists and data scientists that go beyond the scope of a single study.
This development helps break down silos by facilitating Prism data to be reused in workflows at any point along the research cycle, enhancing the efficiencies of scientific progress.
The new format is also a key part of Prism supporting FAIR data principles, which urge organizations to make their data Findable, Accessible, Interoperable, and Reusable. Making data and analyses accessible and reusable, even outside of Prism, helps ensure that data can have the maximum long-term and collective impact.
New Tools for Graphing, Analysis & Collaboration
Prism 10 offers a number of brand new tools designed to help users get the most from their data. Some of the highlights include:
Graph Inspector: Provides a new level of control over data visualization by combining scientists’ favorite customization tools in one location for multiple variable graphs. Offers real-time changes and visualization updates, and the ability to craft bubble plots more quickly and intuitively.
Simplified interpretation of results: Features a new responsive “One or None” P-value summary style for simpler and clearer interpretation of statistical significance. Assigns a single asterisk if it is lower than the statistical threshold (alpha), and no asterisk if it is greater, no matter what value of alpha is chosen.
Expanded data capabilities: Faster performance and support for larger data sets than previous versions. The number of columns in a single data sheet has doubled. Users can have data in up to 2048 columns (with up to 512 subcolumns in each)—this means Prism can now handle over 1 million values in a single row.
Single data point selection: Enables users to select a single data point from a multiple variables graph, and then highlight the selected point to provide information on the variable values used for plotting. Automatically selects other points belonging to the same group on subsequent clicks.
More comprehensive analysis: A new default multiple comparison method has been added for two-way ANOVA. This simultaneously compares rows and columns while properly correcting the results for the number and types of comparisons being conducted. This feature can provide significant time savings and reduce the need for conducting separate analyses.
Faster Performance and Support for Larger Data Sets
As modern datasets grow increasingly large and complex, analysis tools must adapt. Changes to Prism 10 allow scientists to smoothly and efficiently manage vast quantities of data for analysis, graphing, and visualization. Updates include:
The ability to create up to 2048 columns (each with up to 512 subcolumns) in a single data sheet. This is double the capacity of previous versions of Prism and 64 times the capacity of an Excel sheet.
If working across separate files, users can open as many windows as needed. Previous versions of Prism allowed a maximum of 16 windows open at one time.
Critical actions, including opening and saving files, occur faster. Prism 10 should feel quicker and more responsive, even when working with large amounts of data.
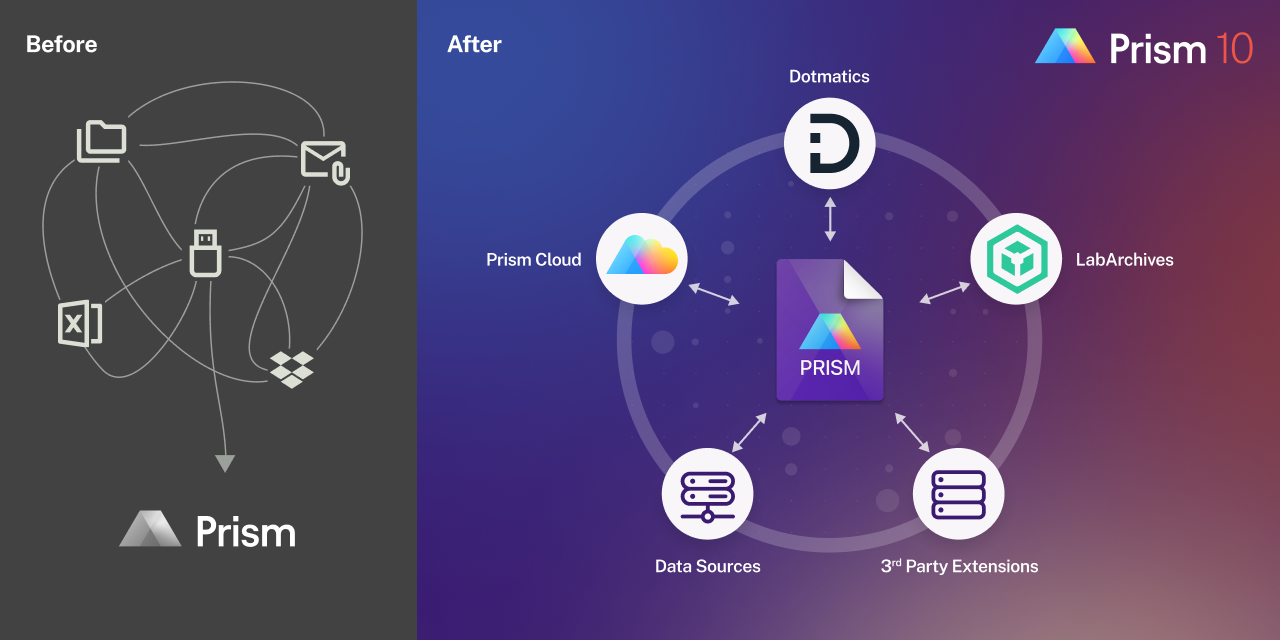
Industry-Leading Integration
GraphPad Prism now offers built-in integration with the Dotmatics platform. Scientists can now export assay data directly from Dotmatics to Prism, representing a key step toward making data easier to find, access, interoperate, and reuse. Integration also saves time and eliminates the need to manually export, format, and import data.
With the new integration, users can:
Export aggregated assay data from multiple experiments to Prism
Export assays from a single screening experiment to Prism
Create Prism templates with preset analyses and graphs
“Scientists working to discover and develop life-saving therapies must be able to navigate mountains of complex data, yet they are impeded by technologies and processes that hinder openness, reproducibility and collaboration,” said Trajen Head, PhD, and head of product strategy for Prism at Dotmatics. “The industry is moving towards adopting FAIR standards to address these challenges and Dotmatics is committed to helping organizations extract greater value from their data. This update is a massive leap forward for the 750,000 scientists who use Prism in their workflows.”
Next Steps
Learn more about the new features available in Prism 10.


