Effective Scientific Data Visualization & Analysis Software
High-performance Visuals that Support Scientific Decision-Making


Versatile Scientific Data Visualization Software
Bench scientists can access structured guidance for project-level analysis, while senior data scientists can conduct ad-hoc explorations of data within and across projects.
Integrated Scientific Workflows
Simplify scientific process automation and workflow management by seamlessly importing datasets from multiple sources and exporting results for presentations, decision making or further processing.
Efficient and Actionable Insights
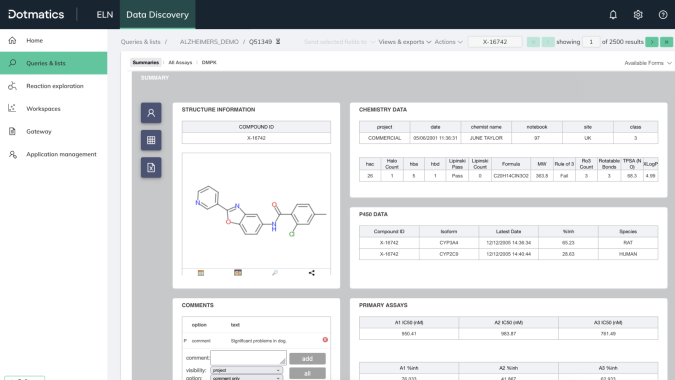
The intuitive data visualization tool includes tables, plots and charts that deliver clear and timely information that expedites the scientific discovery process.
Intuitive Data Exploration Features that Accelerate Innovation


Tools for Every Dataset
A variety of scientific analytics tools are optimized for standard project-level data processing or company-wide, cross-project investigations.
Powerful Data Visual Functionality
Filters and highly configurable charts, tables and grids for high volume data and analyses that require chemistry intelligence.
Production-Quality Scientific Visualization Tools
Elegantly graph, present, and share your scientific research with Graphpad to optimize research data lifecycle management.
Curated Analysis Frameworks
Guided workflows enable scientists without extensive data science training to perform key statistical, cheminformatics and bioinformatics analyses.
Advanced Ad-hoc Exploration
Experienced data scientists can use sophisticated data manipulation and plotting capabilities to understand, refine and interact with very large and complex datasets.
Utilize Specialized, Built-in Tools
Conduct cheminformatics analyses, including R-group, enumeration, SAR and matched molecular pairs.
Comprehensive Graphical Suite
Visualize structures and high-volume data using interactive tables, grids and matrices; bar, line and pie charts; scatter, surface and radar plots; heat maps, plate viewer, 2D SAR visualization and more.
Shared Workspaces
Use virtual workspaces for managing and sharing research data, templates, and insights with colleagues for joint team analysis and real-time decision making.
Ready to transform to data-driven decision making? Let’s talk.
Get in touch so we can provide you with a demo based on your specific needs.


